
The Assortment Optimization Process, Step by Step


Share
Summarize with AI
We covered what assortment optimization is and why it matters in our pillar guide. This article goes one level deeper: the actual mechanics of how the five-stage process works, and where most retailers get the details wrong.
- The process runs in six steps: build the data foundation, run an ABC analysis, cluster stores, model the optimal assortment per cluster, run the listing/delisting cycle, and implement, measure, repeat.
- ABC analysis typically shows the top ~18% of SKUs generating up to 78% of category profit, with the bottom tier contributing as little as 5% of revenue.
- Store clustering by shared microlocation factors captures most of the benefit of full personalization without managing thousands of unique ranges.
- Every new SKU listing should trigger a delisting review at the same time, otherwise assortment creep is almost guaranteed.
- Machine learning is compressing steps 1 through 4 from a quarterly exercise into a continuous one.
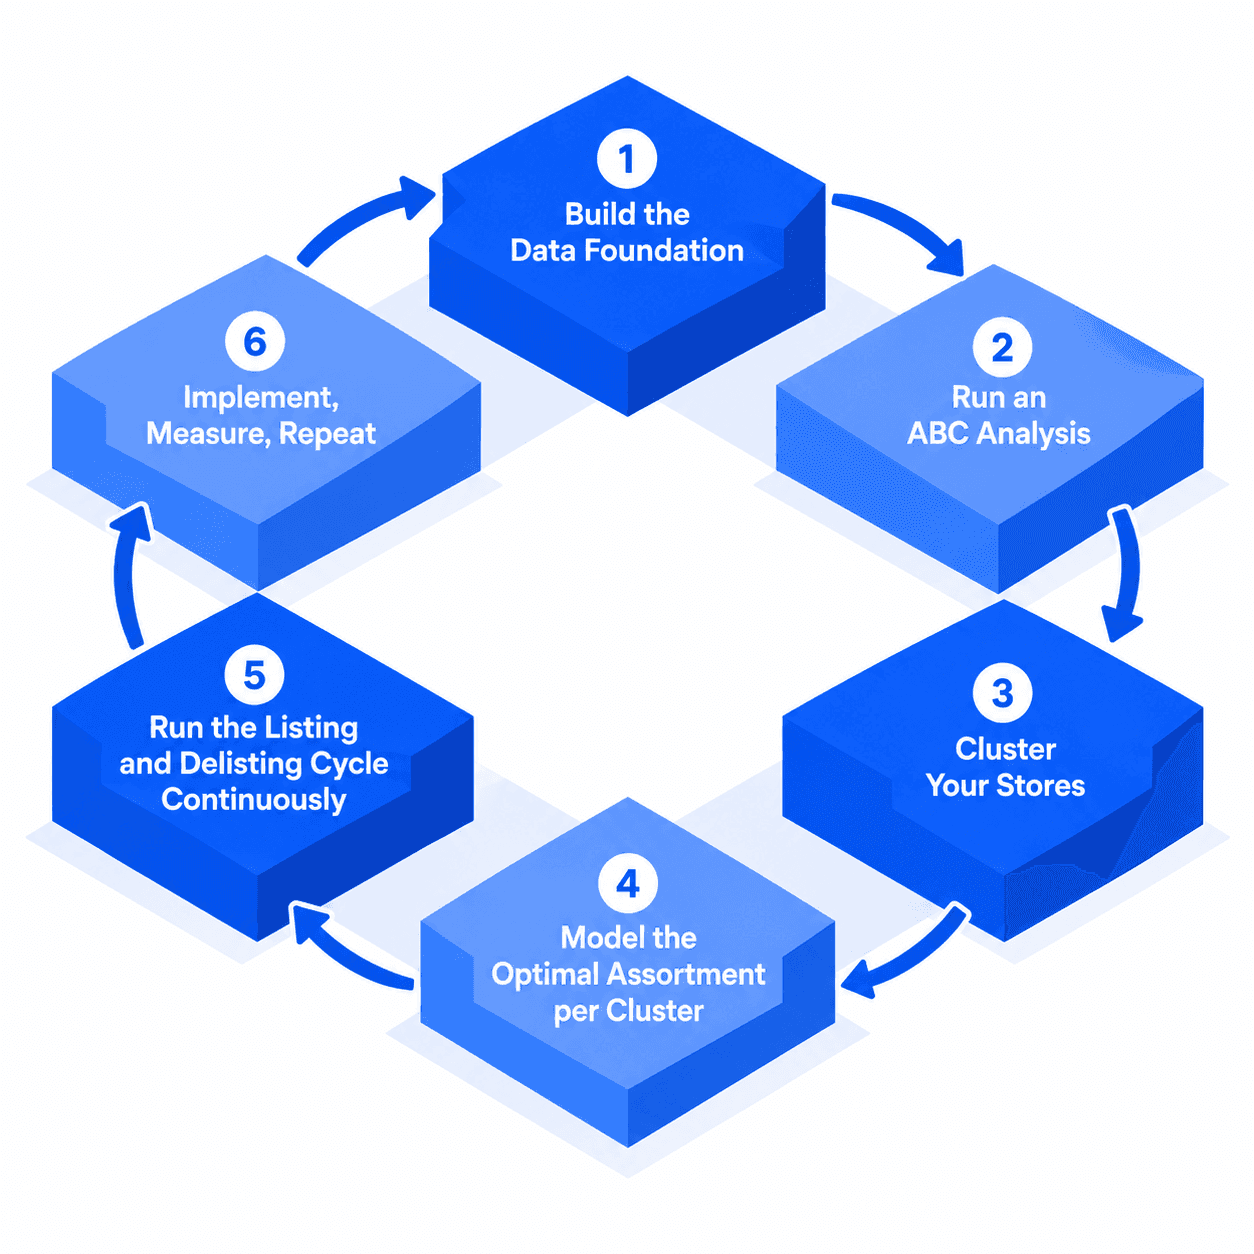
Step 1: Build the Data Foundation
Before any analysis starts, you need three layers of data in place: SKU-level sales history (at least 12 months, ideally longer to catch seasonality), current space and planogram data for each store, and some view of local demand: demographics, footfall, or nearby competition. Without the third layer, every later step defaults to treating all stores as identical, which is exactly the mistake this process exists to fix. Retailers increasingly pull this from a single data platform, like Hypertrade, rather than stitching it together from separate spreadsheets each cycle.
Step 2: Run an ABC Analysis
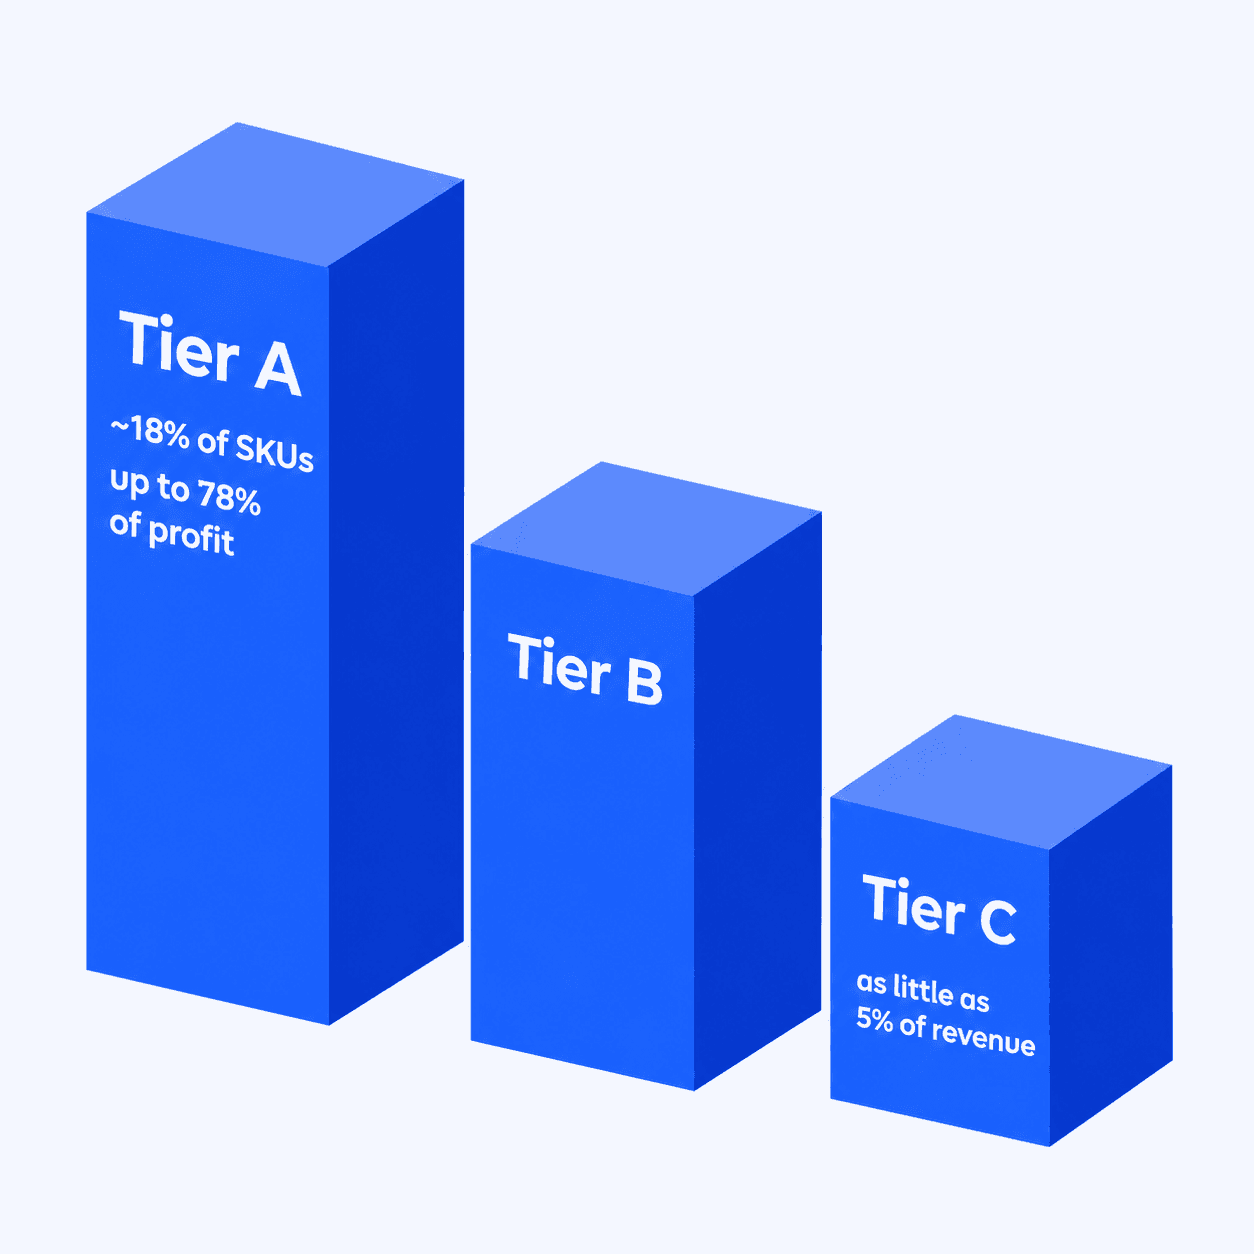
ABC analysis ranks every SKU in a category by its actual contribution to sales or profit, then groups them into tiers. The pattern shows up consistently: a small share of SKUs, often around 18%, typically generates the large majority of category profit, with the bottom "C" tier often contributing as little as 5% of revenue despite occupying real shelf space, the same 80/20 concentration that shows up across most retail categories.
This is the step most retailers skip or do carelessly. Two mistakes are common: cutting every C-tier SKU mechanically without checking whether it plays a strategic role (a low-volume item that completes a range, or blocks a competitor from that shelf position, can be worth keeping), and never re-running the analysis, so a SKU that was a strong A-tier performer two years ago keeps its space long after it's slipped.
The Metrics Behind the Analysis
Running this process well means going beyond the ABC tier and looking at how each SKU actually behaves on the shelf: its velocity (sales rate), %ACV (the share of stores that actually distribute it), on-shelf availability, weeks of supply, and its facings (how much shelf width it holds) relative to its dollars-per-facing productivity. Two related checks matter alongside ABC: incrementality (does this SKU add real category volume, or just cannibalize a similar one already in the range) and adjacency (does its position next to related items help or hurt both). A SKU can look fine on revenue alone and still fail every one of these.
Step 3: Cluster Your Stores
Treating every store the same is the second major mistake this process fixes. Instead of one assortment for the whole chain, the standard practice is to group stores into clusters based on shared microlocation factors: similar demographics, similar footfall patterns, similar competitive density, then optimize one assortment per cluster rather than per individual store or per entire chain. This gets you most of the benefit of full store-by-store personalization without the operational cost of managing thousands of unique ranges.
Step 4: Model the Optimal Assortment per Cluster
With ABC data and store clusters in place, the target range for each cluster gets modeled against three constraints simultaneously: demand (what shoppers in this cluster actually buy), space (what physically fits on the shelf or in the planogram), and category strategy (what the category is meant to achieve: traffic driving, margin, or basket-building). The output is a specific, named list: which SKUs belong in this cluster's assortment, and at what depth.
Step 5: Run the Listing and Delisting Cycle Continuously
This is where assortment optimization stops being a project and becomes an operating rhythm. It's also where SKU rationalization stops being an annual event: the discipline that separates programs that hold their gains from ones that drift back to where they started is that every new SKU listing triggers a delisting review at the same time, rather than getting added on top of an already-full range. Without that pairing, assortment creep is almost guaranteed, and the ABC discipline from Step 2 erodes within a year.
Step 6: Implement, Measure, Repeat
Changes go live, get measured against the pre-change baseline, and results feed straight back into Step 1. There's no natural endpoint to this process, which is the point: markets, competitors, and demand shift continuously, so the assortment needs to as well.
Machine learning is changing how fast retailers can run this entire cycle, specifically steps 1 through 4, which used to take a quarter and increasingly take days.
Common Mistakes in the Assortment Optimization Process
| Mistake | What it costs |
|---|---|
| Cutting C-tier SKUs without checking strategic role | Loses range-completeness or competitive blocking value |
| Optimizing chain-wide instead of by store cluster | Misses genuinely different local demand, underperforms both ends |
| Listing without a paired delisting review | Assortment creep, margin erosion within 12 months |
| Treating it as an annual project | Data goes stale, the range drifts back to where it started |
| Running the process from scattered spreadsheets and disconnected teams | Data orchestration breaks down across time zones and tools, slowing every later step |
Where This Sits in the Retailer Relationship
Assortment work rarely succeeds as a purely internal exercise. The range a supplier wants and the range a retailer will actually carry get reconciled inside the joint business plan, which is why the strongest programs treat assortment as a shared initiative rather than a proposal to be defended across the table. It's also something suppliers are already being scored on: in the Advantage Report competency framework, range and assortment decisions sit inside Category & Consumer Marketing, alongside objective category insights and product innovation. Suppliers who bring a disciplined, data-backed range proposal tend to be rated meaningfully higher than those who bring a list of products they want listed.
Frequently Asked Questions
What's the difference between assortment optimization and ABC analysis?
ABC analysis is one input into assortment optimization: it ranks SKUs by contribution. Assortment optimization is the full process that uses that ranking, alongside space and demand data, to decide the actual range per store or cluster.
How many store clusters should a retailer use?
There's no fixed number. It depends on how much genuine variation exists in demographics, footfall, and competitive density across the estate. Too few clusters loses the local-relevance benefit; too many becomes operationally unmanageable. Most programs start with 3-6 clusters per category and refine from there.
Should assortment optimization be done by category or by store?
Both, but in sequence: the analysis runs at the category level (Steps 2-4 above), and the output gets applied at the store-cluster level. Running it purely per-store without category-level ABC analysis first tends to produce inconsistent, hard-to-manage results.
How long does one assortment optimization cycle take?
Traditionally, a full manual cycle (Steps 1-6) runs on a quarterly basis. With data automation and the ML methods covered in the next article, retailers are compressing the data and modeling steps from weeks to days, though implementation and measurement still need real time to produce reliable results.
What tools are used for assortment optimization?
Ranges from spreadsheet-based ABC analysis for smaller operations to dedicated retail analytics platforms (space and assortment planning software) for larger chains running multiple store clusters simultaneously.
The mechanics matter more than the mindset here. A retailer that understands assortment optimization conceptually but skips the ABC discipline, the store clustering, or the paired delisting review will drift back to an unfocused range within a year, no matter how good the initial reset looked.